The Numbers Story
Measuring what we do matters. Every quarter, we gather data from various platforms and bring it all together in easy-to-read graphs and charts. This helps us understand how we’re doing – what we’re doing well and what we can improve. We have support evaluating such a significant project – facts and figures are also passed to independent eyes to discover if we are having the impact that our funders expect. Here are some of our highlights.
One door closes … lots more open
Although our searchroom door is closed to the public, we’ve been busy opening doors all over the county - from museums to markets, cafés to community clubs, town halls to theatres. Since our activity programme started in July 2023, 67 local venues have hosted 130 events, welcoming over 4,500 members of the community.
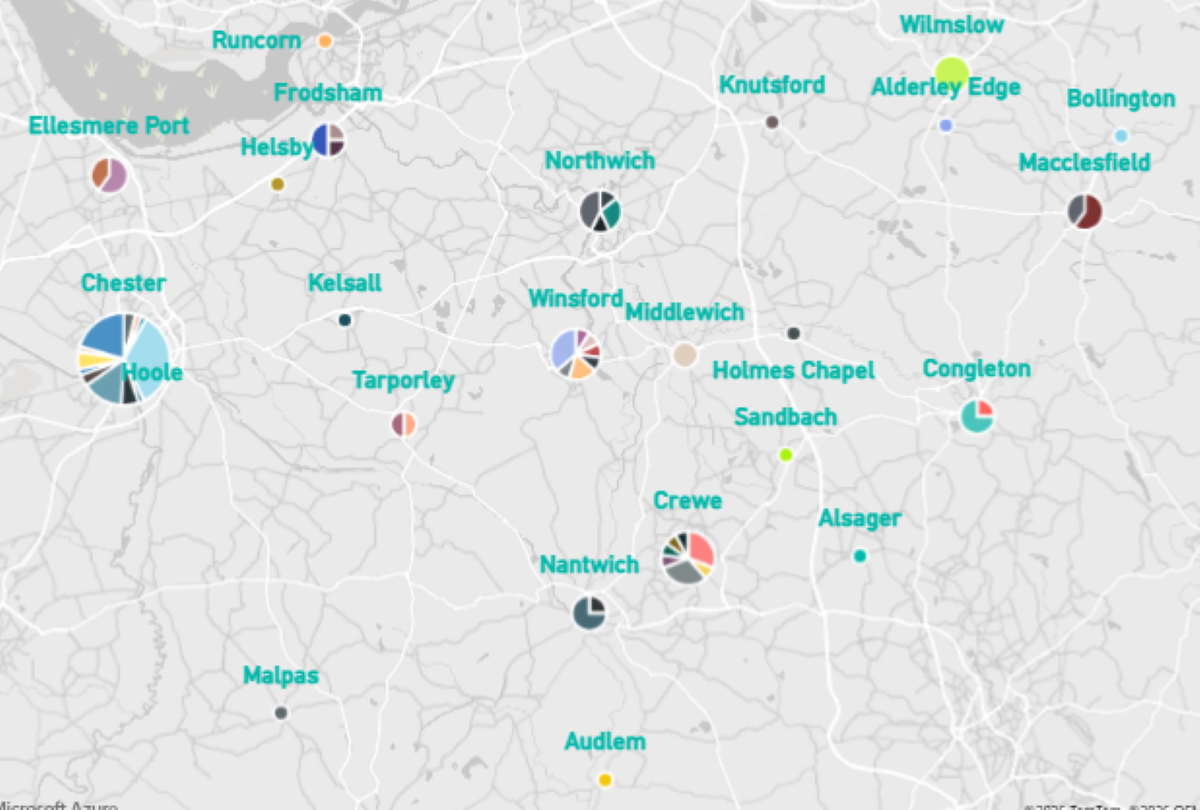
Map of Cheshire showing the locations of the activity programme.
Our team has dedicated over 500 hours to planning and delivering an incredible range of activities, talks, learning programmes, and events. We’re supported by over 70 partners across our councils, charities, and local community groups, not to forget our amazing volunteers who clocked up 1,250 hours in 2025 alone!
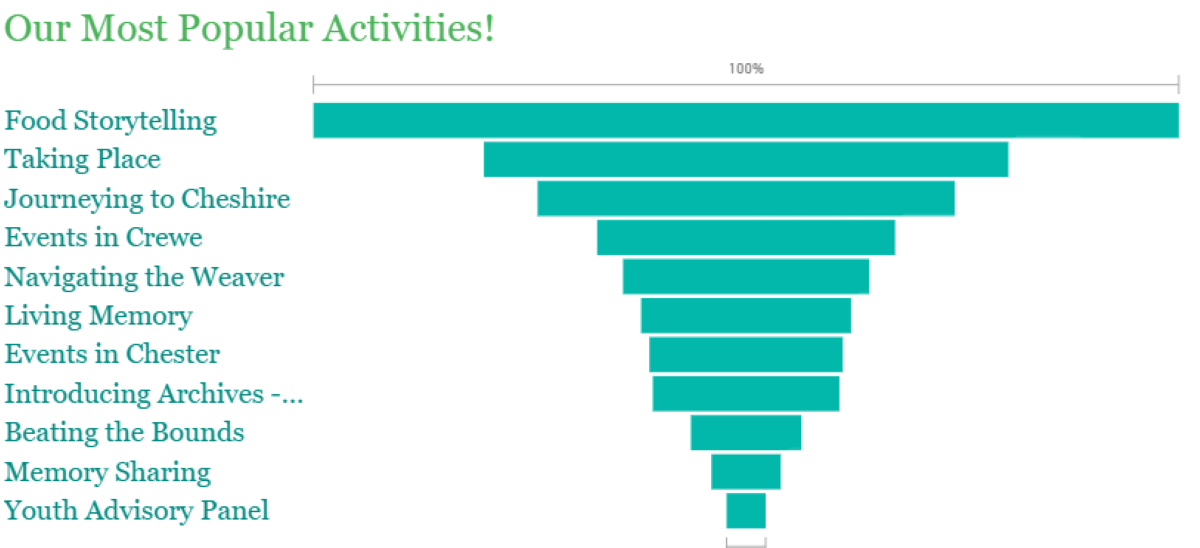
Waterfall graph showing our most popular events by attendance.
A quote from feedback on our popular food storytelling activity strand …“From delving into the recipes; finding out about unusual food combinations and then considering how to present these through different materials, gave all the groups and individuals unique challenges to explore.”
On the climb online
Quarter after quarter, our online community continues to grow with more followers, subscribers, views and visits. Engagement is steadily increasing wherever we communicate on social media, websites, newsletter and this dedicated story shared site. Thank you for your interest, as demonstrated in the graph below.
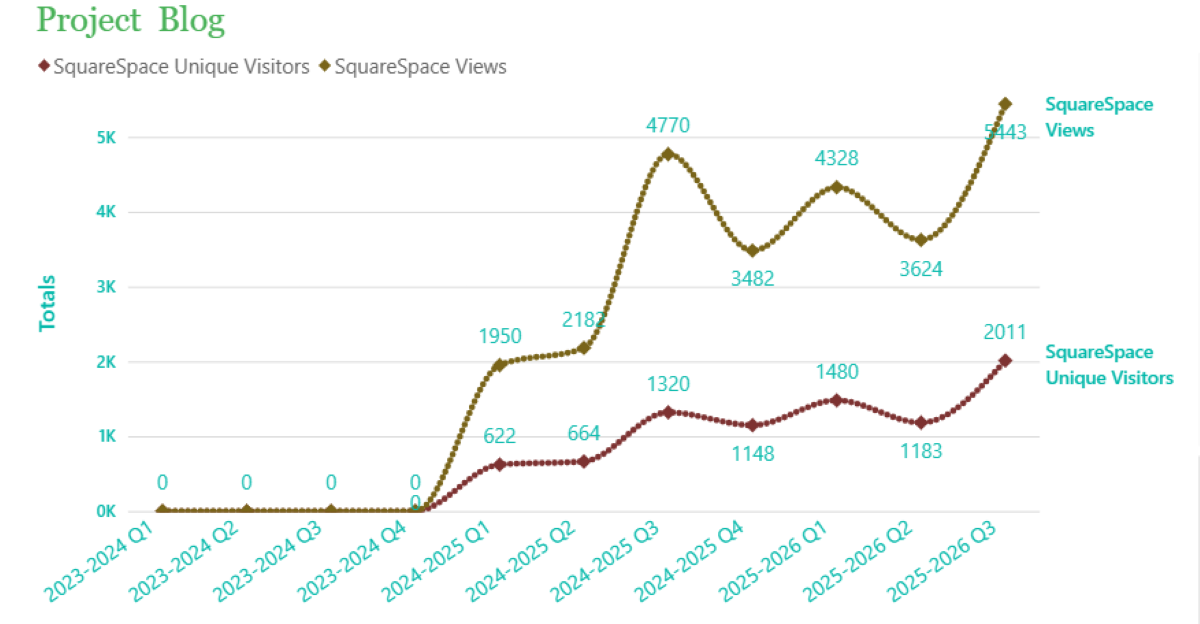
‘Cheshire’s archives - a story shared’ on SquareSpace.
The huge spike below for our Instagram reel about conservation taught us a lot – Instagram users like it best when we go behind the scenes with our people telling collection stories.
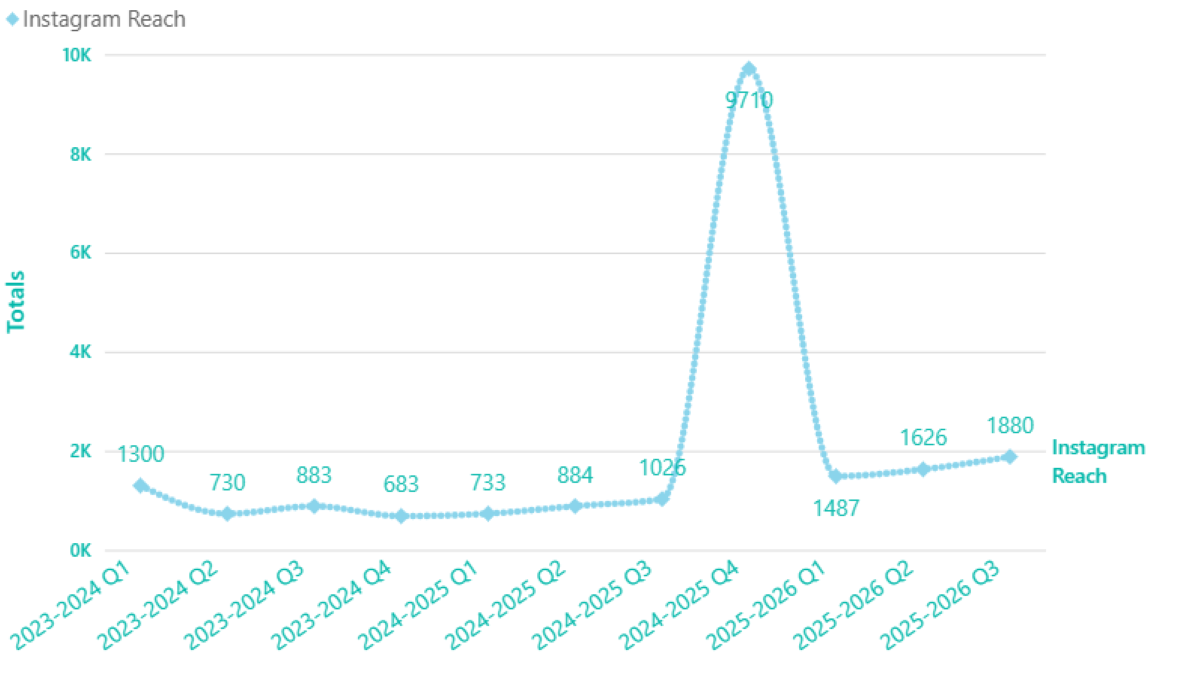
Graph showing Instagram spike at the end of 2025.
The stats can also reveal insights and trends that aren’t immediately obvious. Could the spike for Cheshire Image Bank indicate its usefulness in all the amazing research local history groups, our volunteers and team have done searching for local Gems?
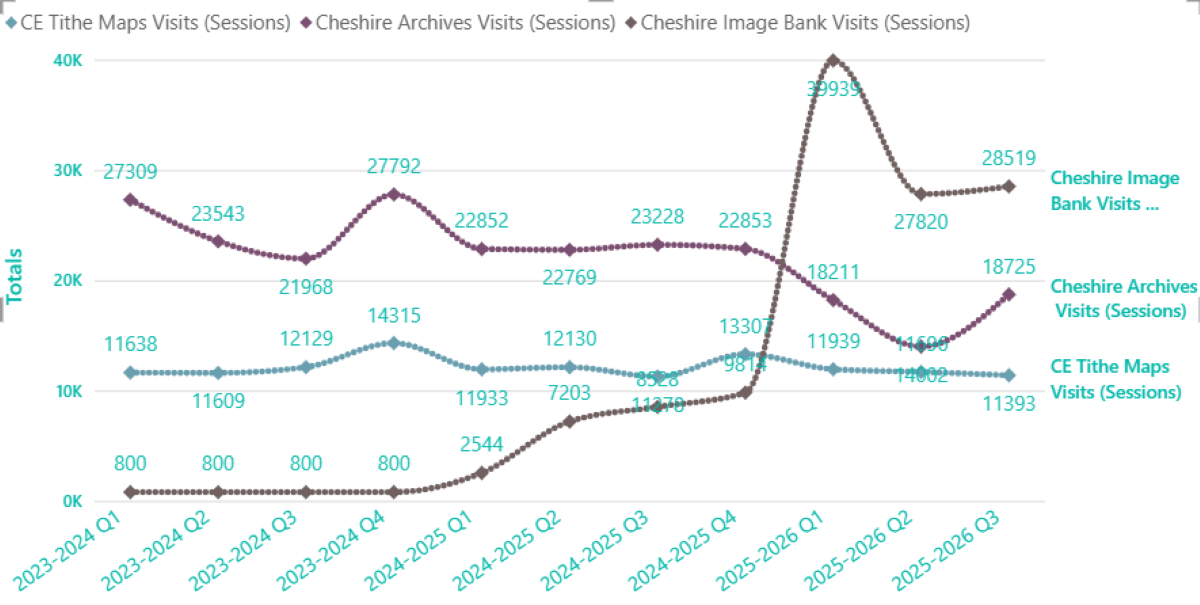
Websites from January 2023 to December 2025.
A quote from Macclesfield Gems contributors … ‘’I enjoyed the research and enjoyed learning new things - even though sometimes I thought there wasn't more to learn - and then there was!”
Not just a number
When we hand out dreaded feedback forms be reassured it is not a tick box exercise – tell us what you really think and your thoughts make such a difference as we begin the exciting stage of programming events in our new centres.
By Branca Pinto da Cruz, Digital Archives Officer